


Water
Flow, water table, flood risk and water harvesting.
Connect your stations, devices and sensors, get alerts when something goes out of range, generate reports with the help of artificial intelligence and control your equipment from the platform.
The whole product is organized by categories, each with its own color and icon.
Flow, water table, flood risk and water harvesting.
Air quality, temperature, wind corridors and heat stress.
NDVI, moisture, pH and soil classification.
Satellite layers on the map.
Ambientech works by projects: we talk first, the monitoring points, devices and sensors are installed, and then you enter the platform.
Fill in the form with what you want to monitor and where.
We review with you the monitoring points, devices and sensors of your project.
The monitoring points, devices and sensors are installed and connected.
You enter the platform and see your stations, devices, sensors and variables.
Alarms, reports, maintenance orders and control of your equipment, all in one place.
Each project is built from these elements, and the platform shows them just as they are in the field.
Each physical monitoring point. You see them on the map, with search and filters by category and status.
The equipment and sensors at each station, with its detail sheet and the variables it measures.
Read values and also send commands to the equipment, with boolean, integer or decimal values.
They receive data from equipment that sends files over FTP, and you can record manual field measurements, even by CSV.
Turn the globe layers on to explore the four categories.
Drag to rotate · Turn layers on and off
Plan your monitoring pointsHow are my water sensors doing?
Ambientin lives inside the platform, available from any screen through its floating launcher. Hover each feature and watch how it reacts.
Rename them, review them in detail and delete them.
Pick a station, variable and period without typing commands.
The assistant returns the series you asked about.
Built from your workspace data.
Microphone button and suggested frequent questions.
Meter for the prompt limit and token usage.
The owner decides which collaborators can use the AI.
The assistant can make mistakes: verify critical data.
Each control point reads and writes values on your devices. Send commands by hand, let the platform apply them when a condition is met, and run everything from a dashboard built your way.
Click the sensor on the tank.
Turn the pump on and move the slider.
Turn on “Self-regulate” and drag the threshold on the tank.
If Tank level % then Pump 1 = ; otherwise,
EventsSimulation with sample data
Send a value to a device (on/off, integer or decimal) and get confirmation that it was sent.
Set a condition on a variable and the value written when it is met and, if you want, when it is not.
Each point links a device, a controller address (M001) and, if you want, a variable.
In run mode, the dashboard updates with the live values of your controls.
Tabs and buttons to move between screens; a button can write a value and change screen at the same time.
Show a value as text: 0 = Stopped, 1 = Manual, 2 = Auto.
A visual editor with edit mode and run mode: duplicate, order by layers, undo and redo, and set a background image. When you delete a control, it tells you which widgets depend on it.
Switch · Push button · Slider · Gauge · Indicator · Number input · Dropdown · Animated pipe
More than 20 widget types in seven categories: Indicators · Buttons · Inputs · Data · Multimedia · Shapes · Date and time.
Search, pagination, detail sheet and variable assignment.
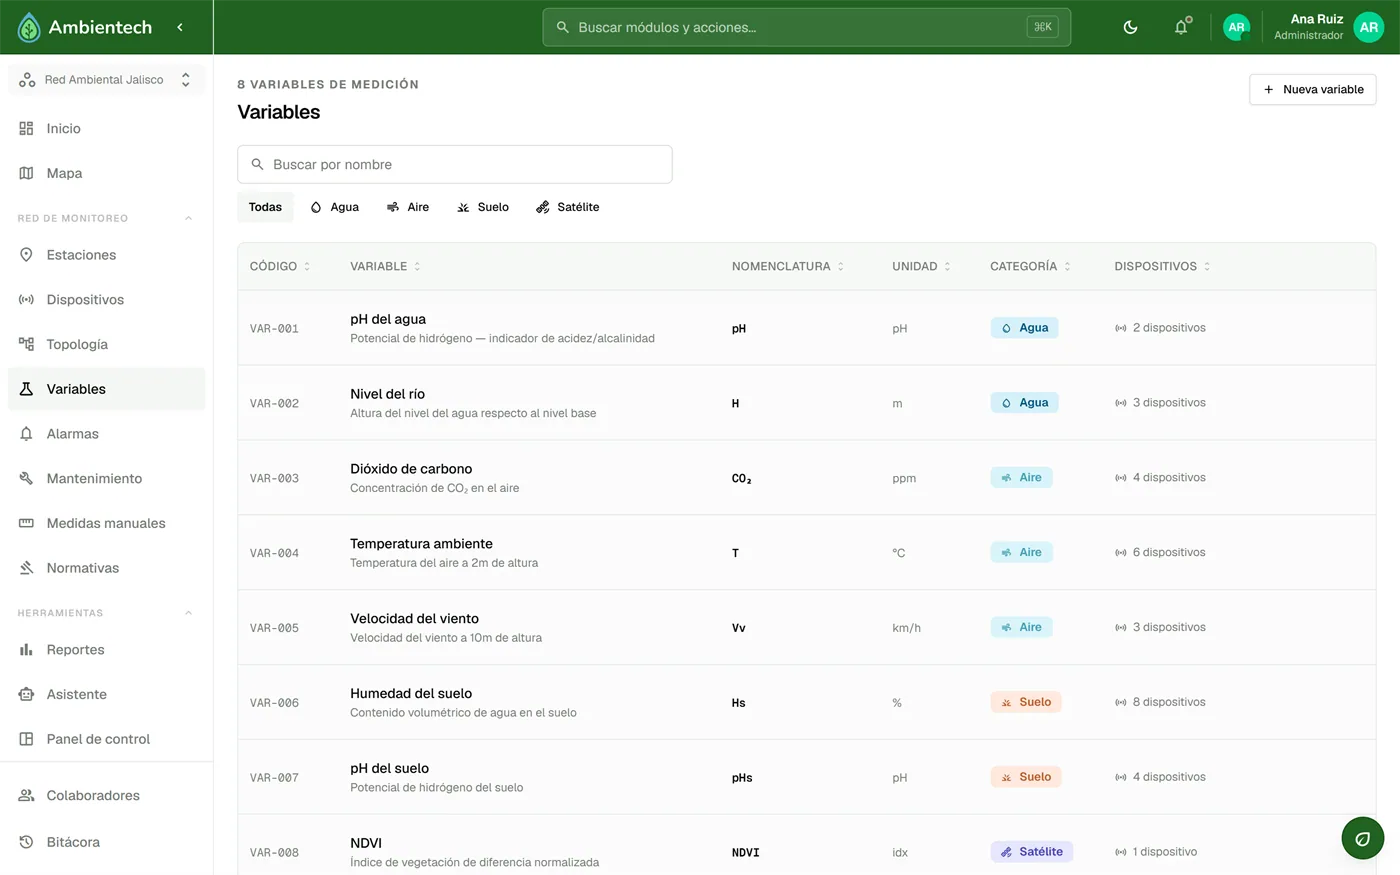
With code, naming, unit and category.
Visual hierarchy of stations, devices, sensors and controls.
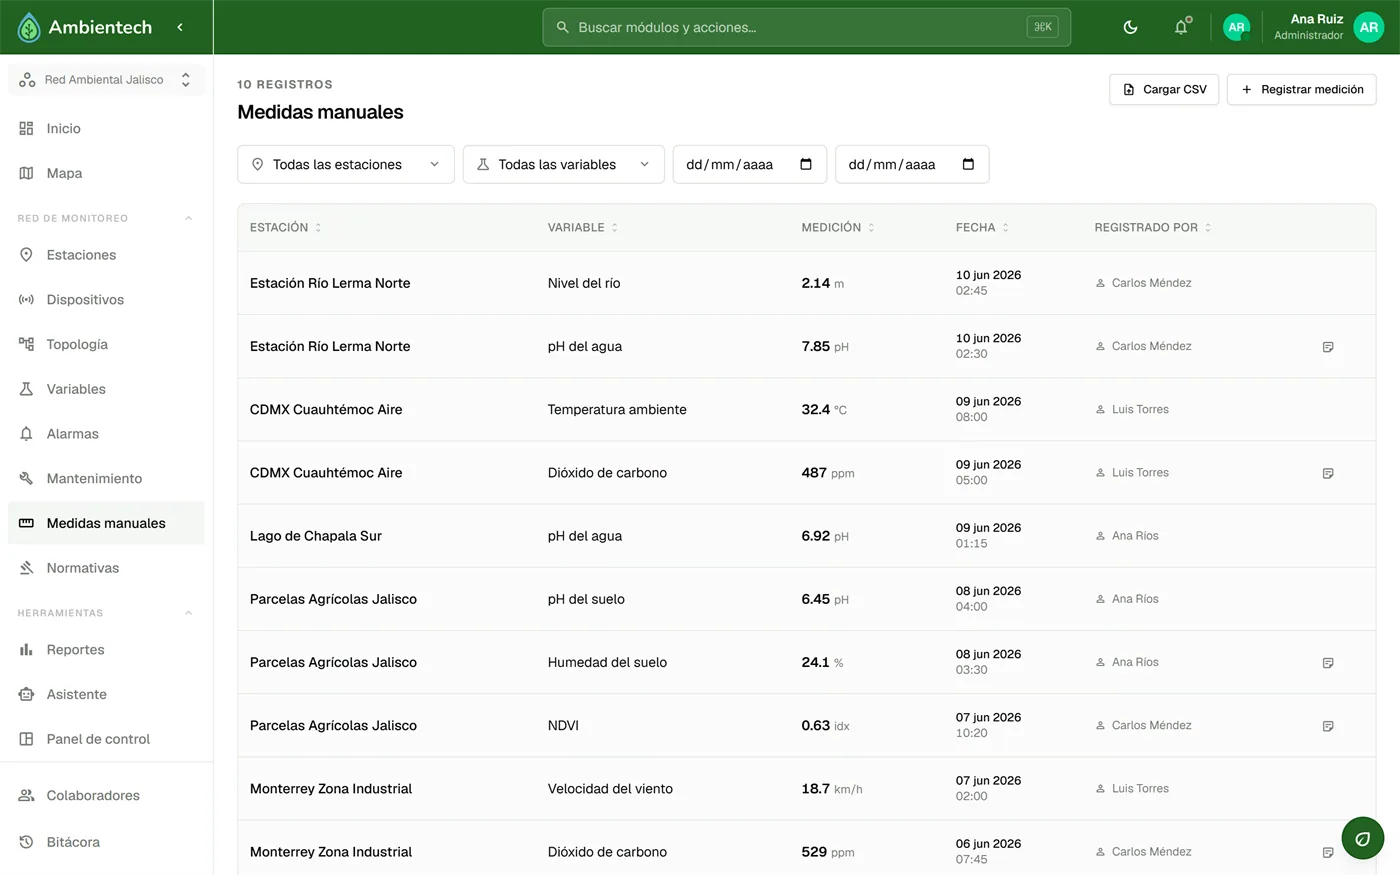
Field records by technicians, with CSV upload and a downloadable template.
Receive data from equipment that sends it as files.
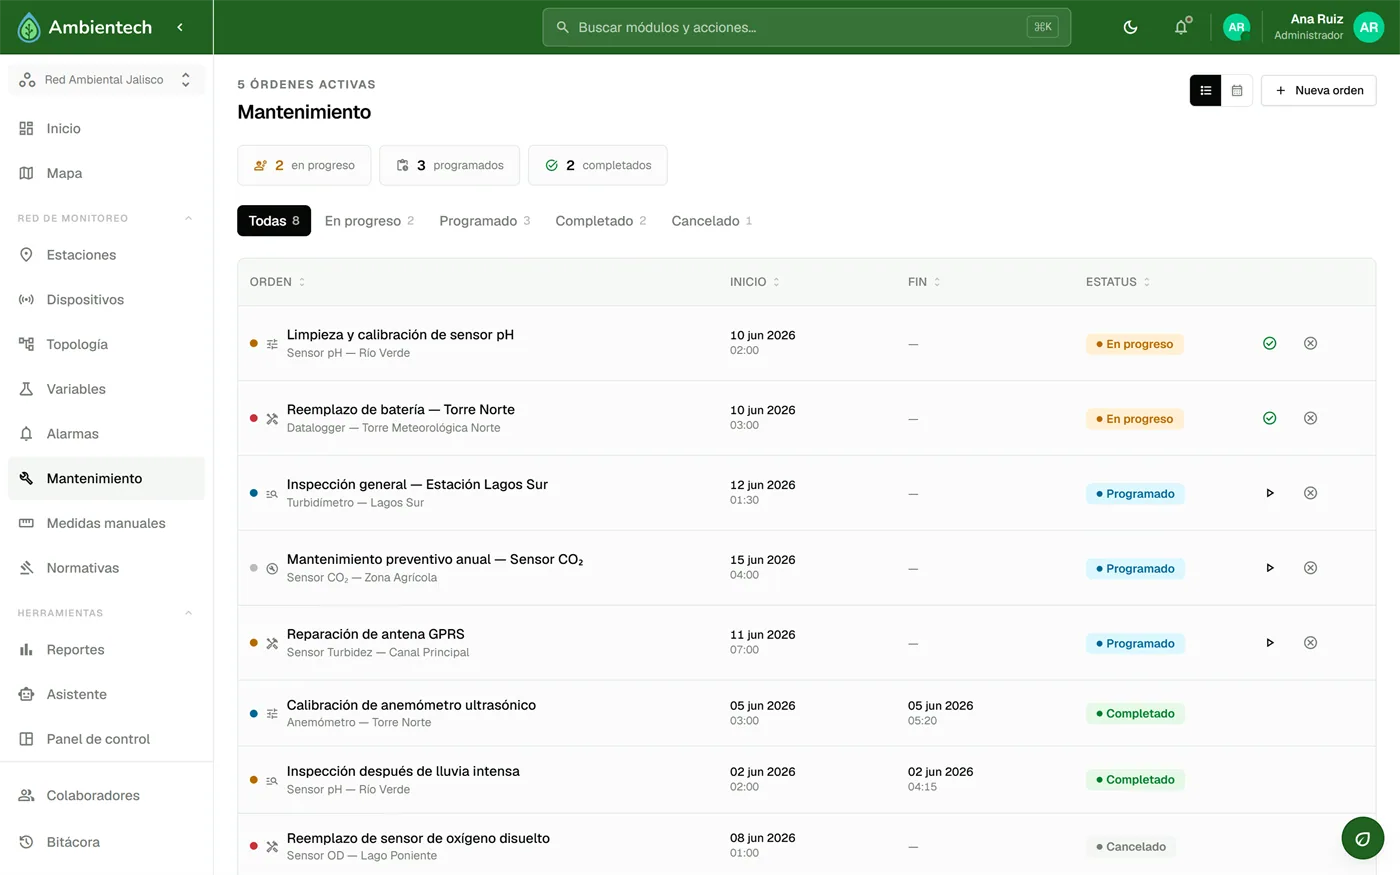
Work orders with statuses, as a list and a monthly calendar.
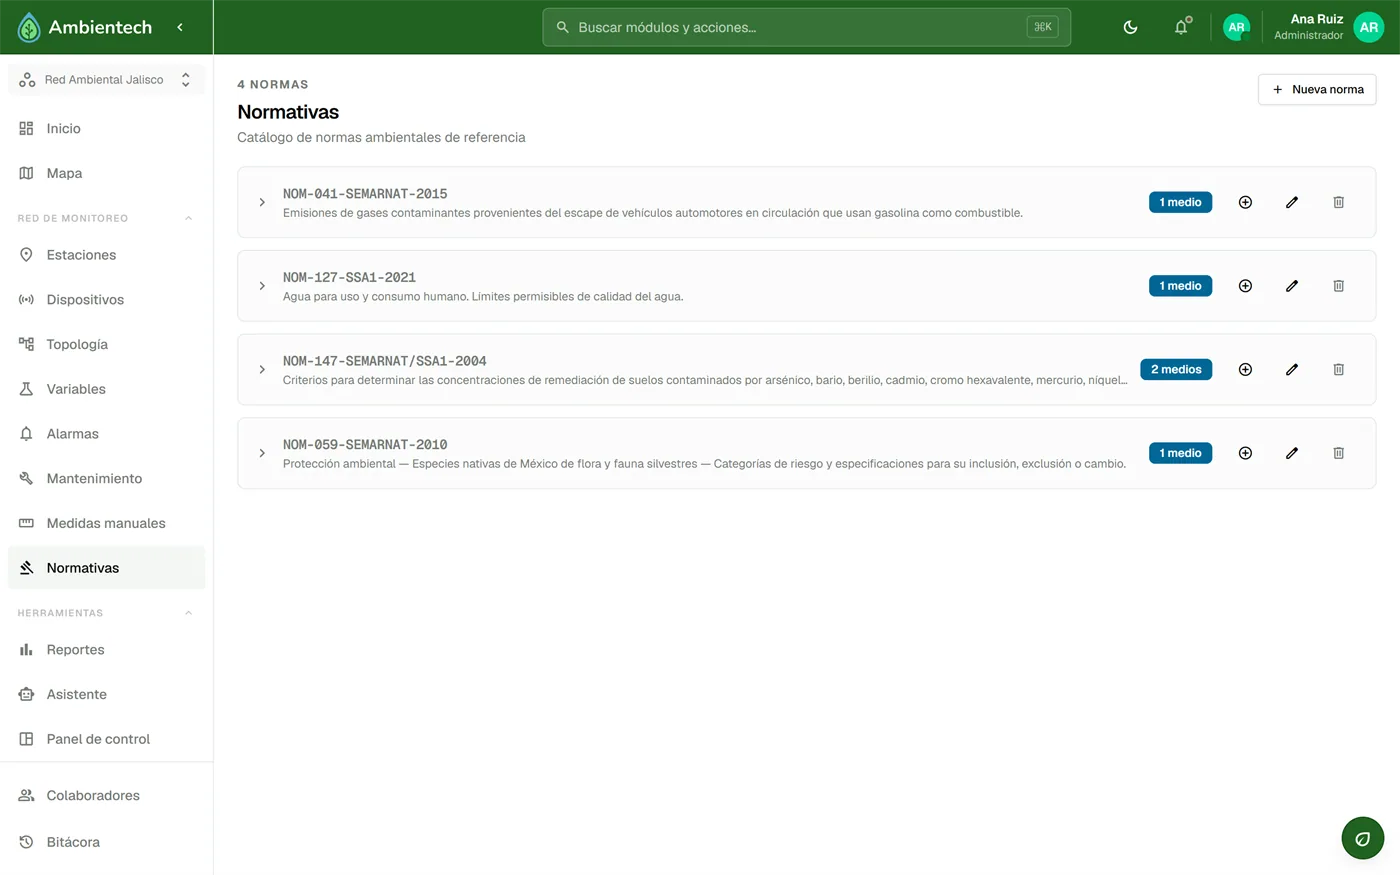
Catalog of environmental standards with parameters and minimum and maximum ranges.
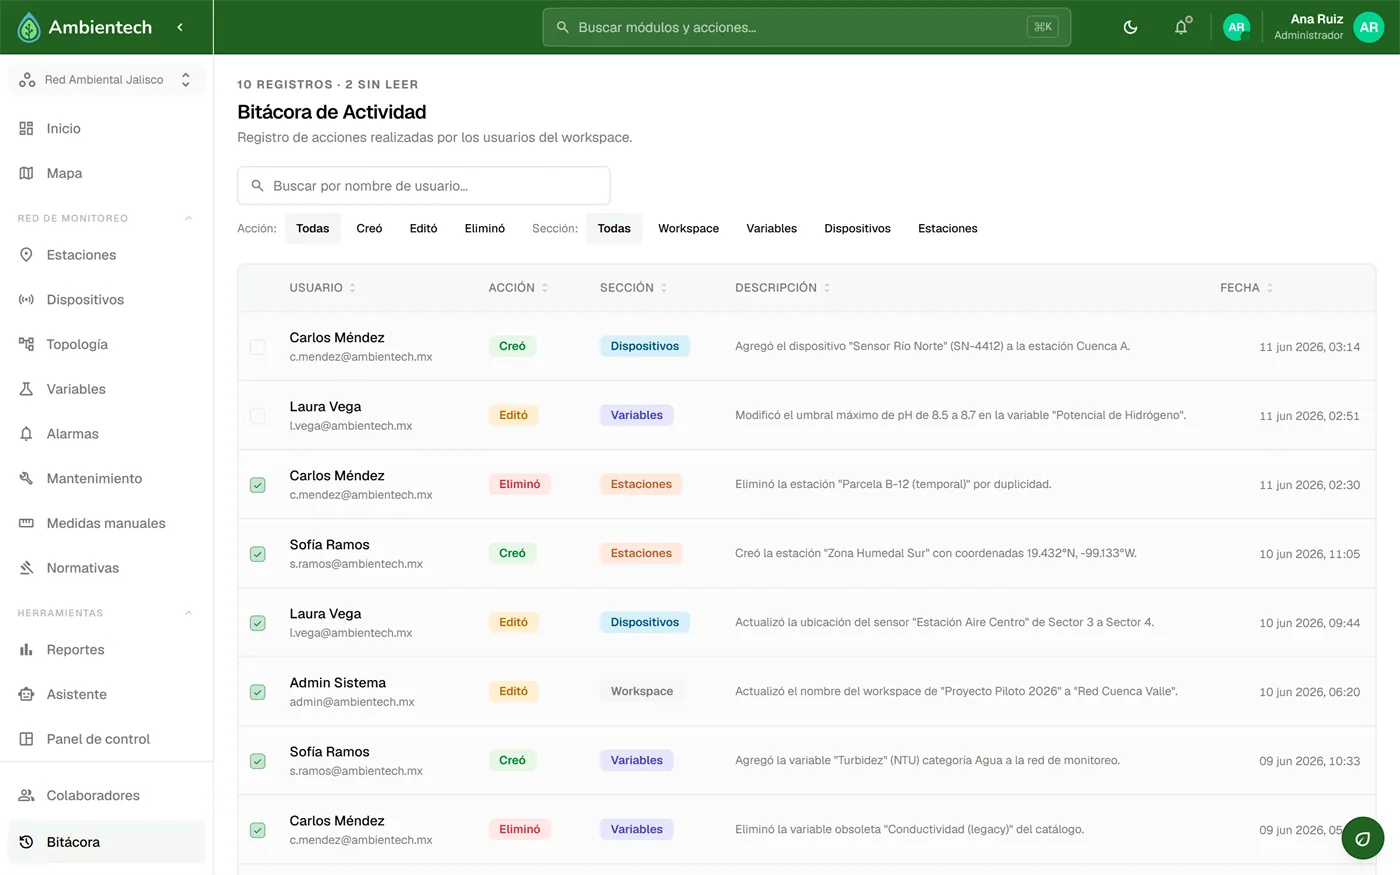
Who created, edited or deleted what, and when.
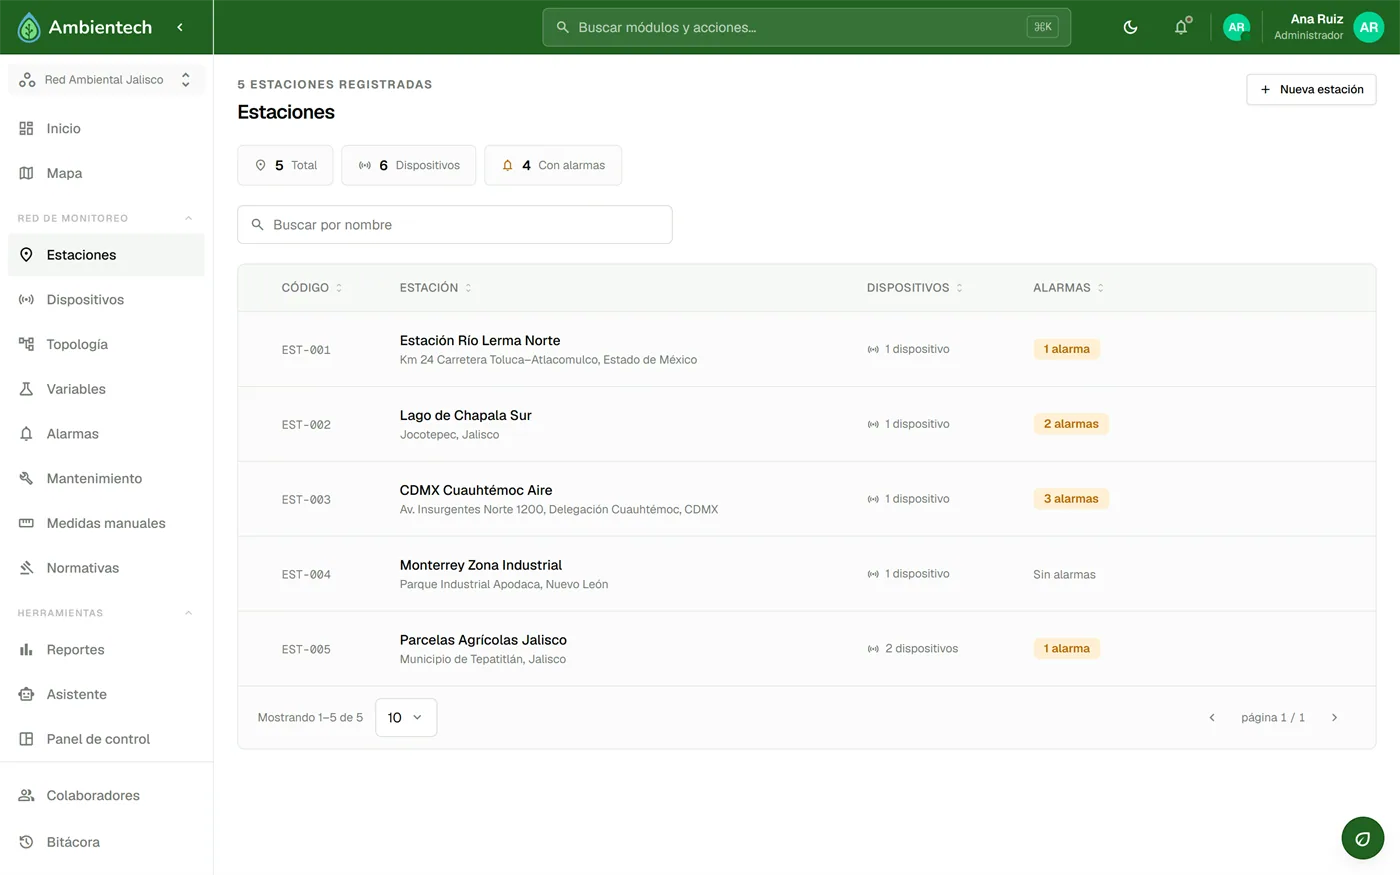
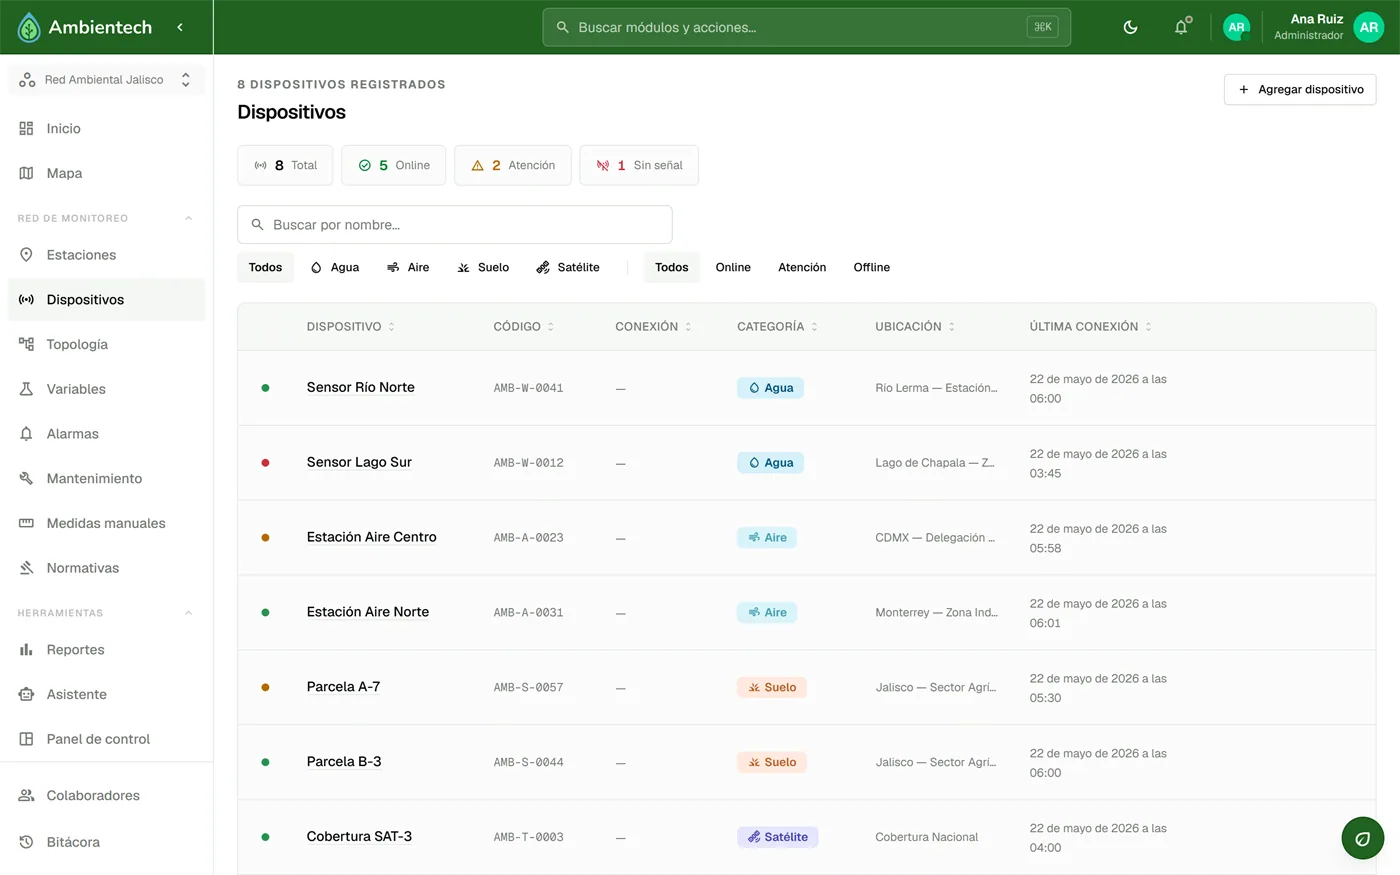
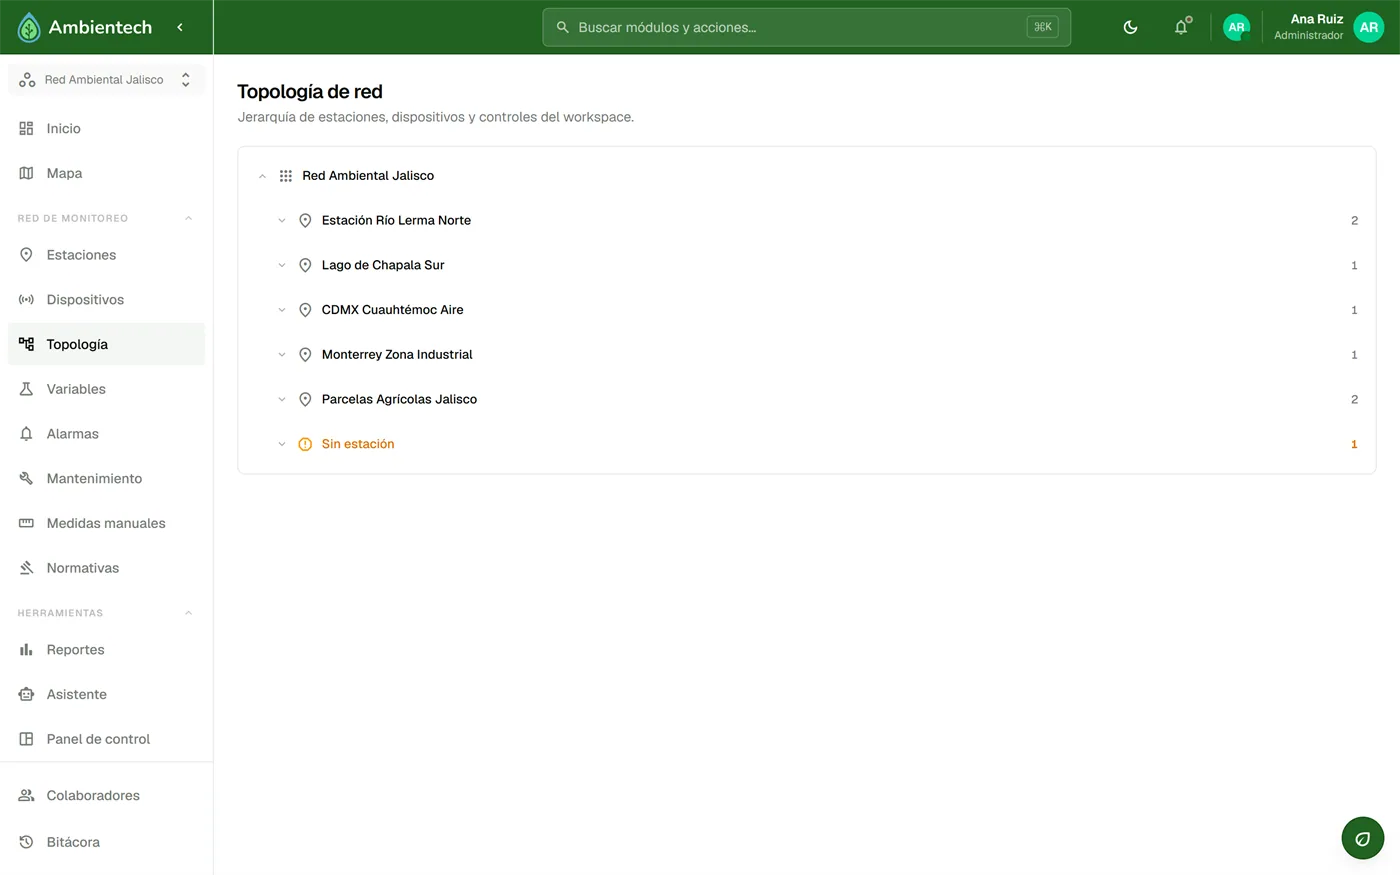
Three privilege levels
Decides AI access and the workspace’s sensitive actions.
Manages the space according to the permissions of their role.
Takes part in the workspace with the permissions assigned.
With a smooth transition.
The platform is available in both languages.
Environmental summary
Good morning, Ana
Brand
Logo
Accent color
A workspace can upload its logo and colors.
On phones, a bottom bar; on desktop, a collapsible side menu.
 Coming soon
We are designing the mobile version: dashboard, devices and sensors, alarms, stations, reports and their detail screens.
The latest from Ambientech. Open each story to read it in full. News is published in Spanish.
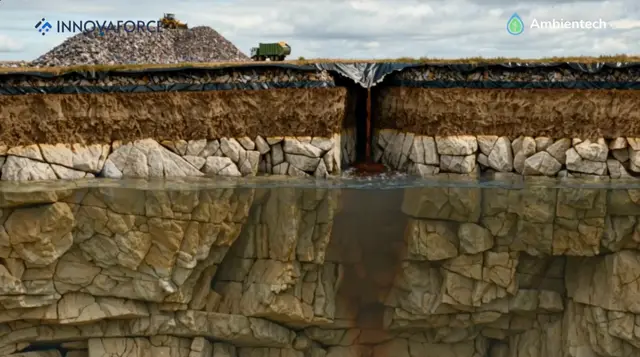
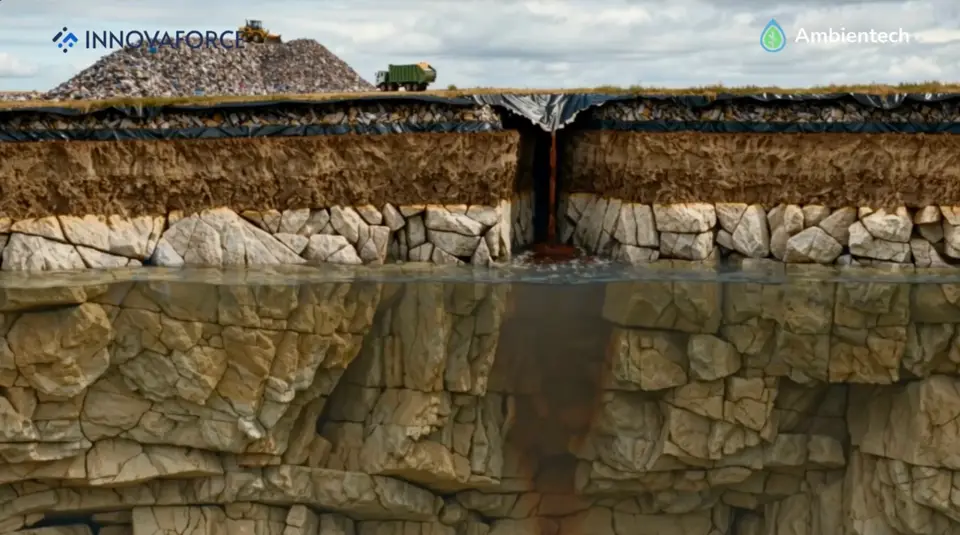
El monitoreo de rellenos sanitarios y vertederos en sumamente importante.
Read more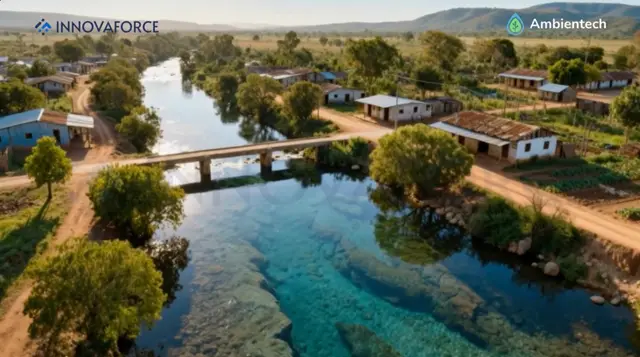
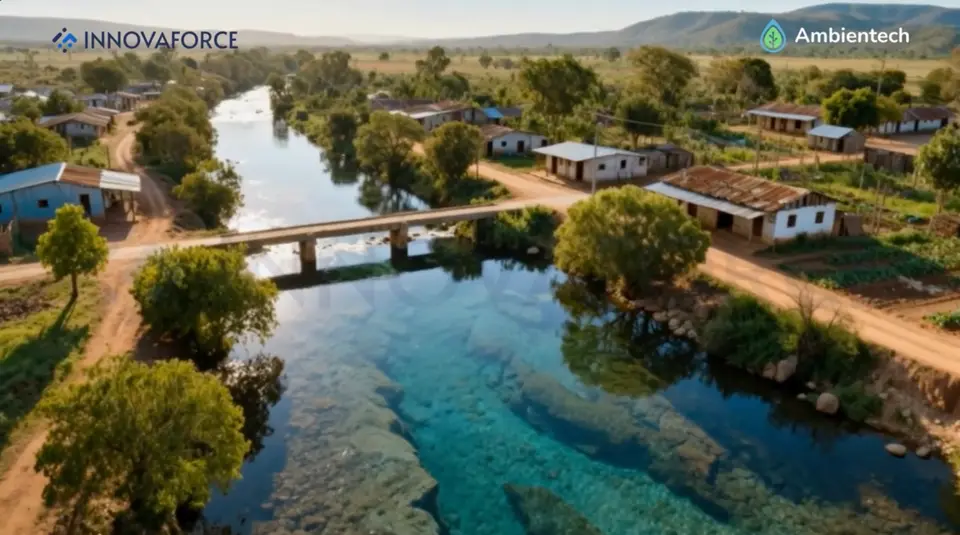
Ambientech permite el monitoreo de rios, lagos y cuerpos de agua en tiempo real
Read more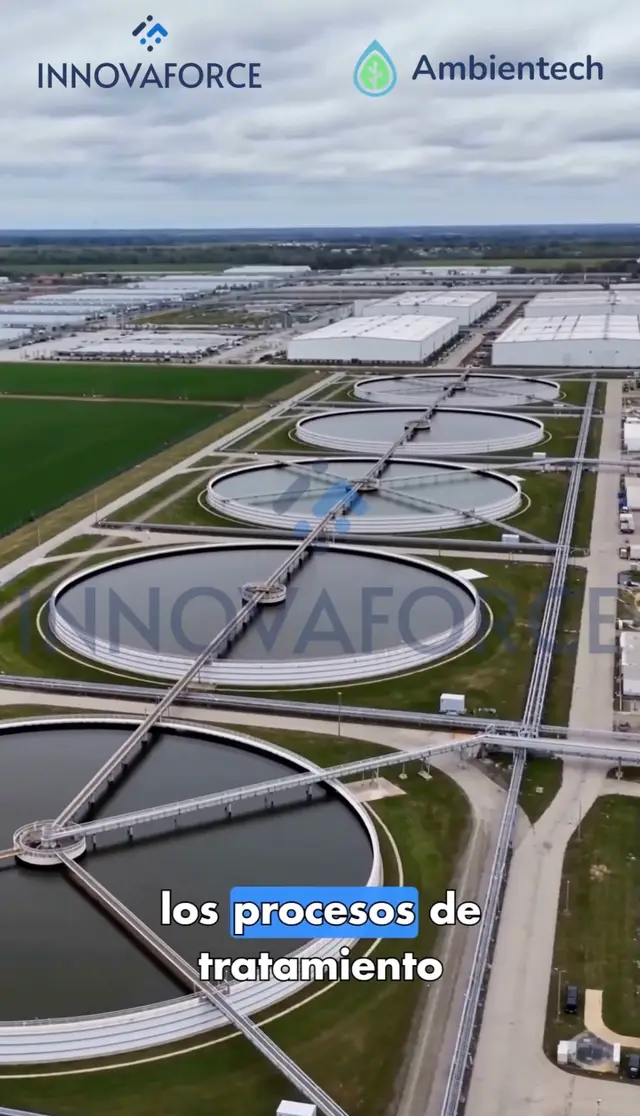
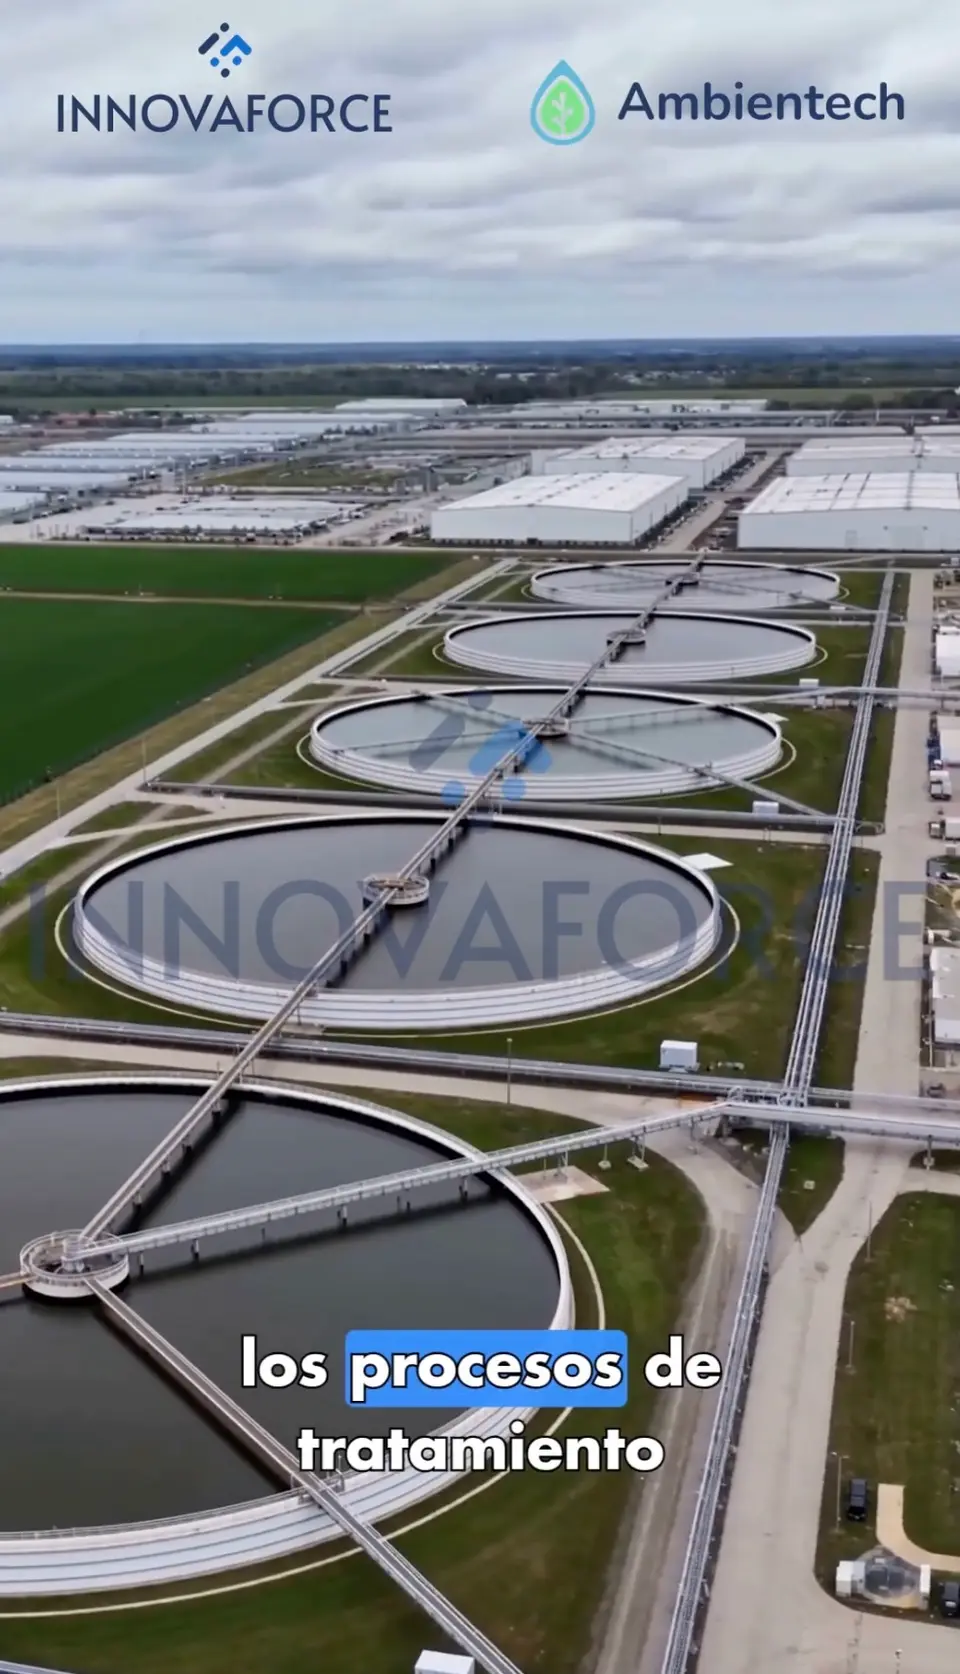
Ambientech ayuda a realizar el correcto tratamiento de las aguas residuales mediante el monitoreo y control de los procesos asociados a estas.
Read more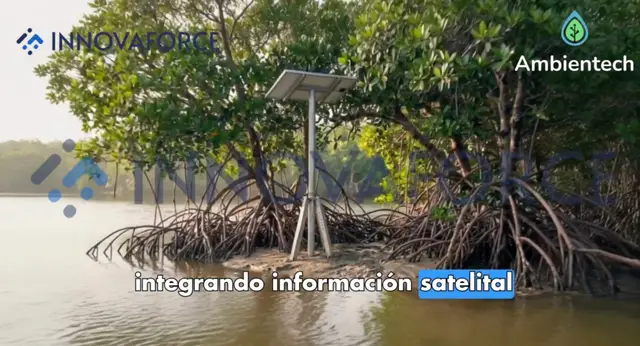
Como podemos monitorear con mejor precisión la salud de los manglares y el CO2 capturado en estos?
Read more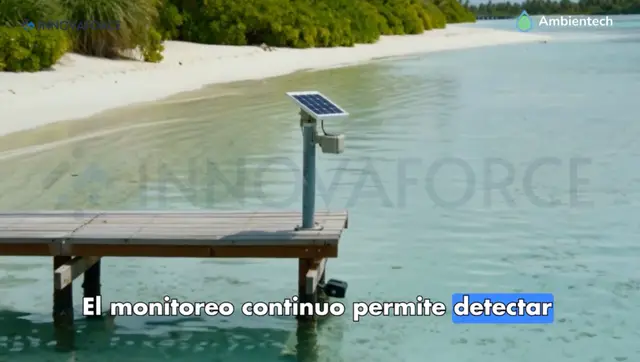
Implementación del monitoreo de playas y costas
Read more
INNOVAFORCE - Participo apoyando el proyecto con la plataforma Ambientech y la tecnología para de monitoreo en tiempo real el acuífero de la península de Yucatán.
Read moreEnvironmental monitoring and control in operation, in two real projects.
Monitoring of the underwater mass of the cenote ring in the Yucatán peninsula, at 6 measurement points.
Measurement point: Homún · It measures all 10 variables at this point.
Variables measured · 10
On the platform
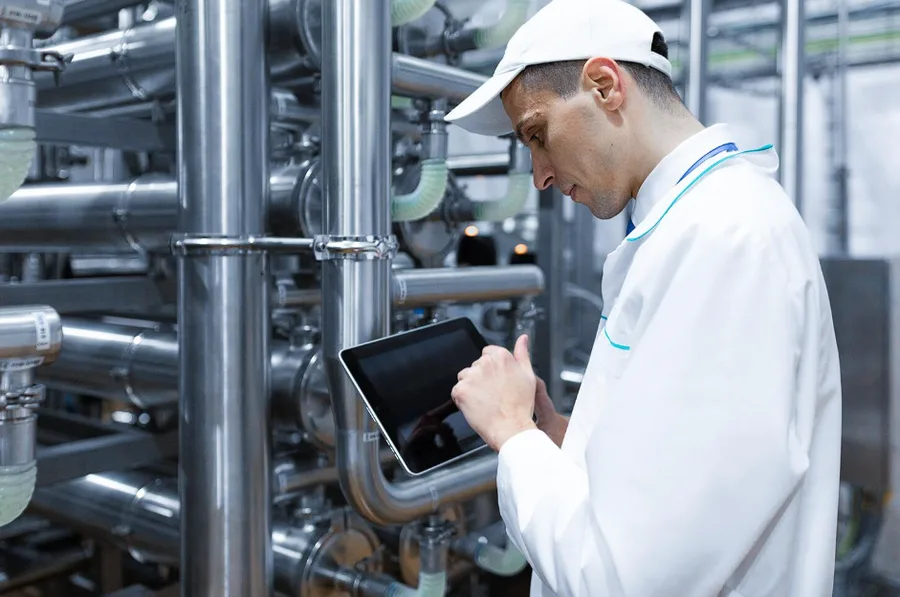 UADY
A mobile wastewater treatment plant: it processes the leachate from the city of Mérida to reduce its environmental impact on the soil of Yucatán.
Operating mode
The actuators run on their own, in continuous treatment.
Simulation with sample data
Monitors
Depth and pH sensors
Controls
Solenoid valves · Motors · Centrifuges
Remote control from Ambientech
One platform to see the state of your territory, get alerts and share reports with your team.
Create accountCan’t find your answer? Write to us and we will help.
Email usWith a conversation. You fill in the contact form, we write to you to review what you want to monitor and which monitoring points, devices and sensors are needed, and then you create your account to see everything in the platform.
Because Ambientech works by projects: the data comes from your project’s monitoring points, devices and sensors, and the platform organizes it by station, device or sensor and variable.
It depends on what you need to monitor and how many points, devices and sensors it includes. Tell us your case in the form and we will review it with you.
A map with your stations, devices and sensors, alarms, reports, a dashboard, maintenance with work orders and the AI assistant.
Yes. Each control point reads and writes values on a device (on/off, integer or decimal). You send the value from the platform or from a widget on your dashboard, and the platform confirms that the command was sent.
It means letting the platform write a value for you based on a condition on a variable: greater, greater or equal, less, less or equal, equal, not equal or between two thresholds. You set the value written when the condition is met and, if you want, another when it is not.
Water, air, soil and satellite. Each has its own color and icon, and its own variables in the platform.
You can manage stations, devices, sensors and variables, receive data from equipment that sends it as files over FTP, and record manual field measurements, including CSV upload.
With alarms per variable, defined with a comparator and a threshold. They have a severity (critical, warning or informational) and a status (active or resolved), and you get notifications in the bell on the top bar.
It answers in a chat, offers a guided query by station, variable and period, returns charts, generates reports and supports voice input. It can make mistakes, so critical data should be verified. The owner decides who can use it.
Yes. Each organization or project has its own workspace, you invite collaborators by email and there are three privilege levels: owner, administrator and collaborator.
The platform is responsive and can be used from a phone. The mobile app is being designed and will arrive soon.
In Spanish and English, with light and dark modes.
Every Ambientech project starts with installing monitoring points, devices and sensors. Tell us what you need and we will get in touch.
Is your project already underway?
contacto@innovaforce.com.mx



The pH rises at the end of the week. Let’s check the sensor.
Agreed, I’ll schedule the maintenance visit.